
I’ve Read Thousands of Financial Analysis Reports, But Only 7% Achieved Distinction. Here’s How You Can Ace Your Assignment

Numbers…ughhh…I’m sure many of you don’t like it!
But for business people, the reality is…money is always involved, isn’t?
For business students, I’ve seen many people who were very good in computations, but still struggle to earn a distinction.
The secret is that: Getting the numbers right is only half the battle. You also need to explain what those numbers actually mean for a business.
Think about it: a company might report impressive sales but struggle to pay its bills. Another might make modest profits yet manage its resources exceptionally well.
So, how do you tell whether a business is genuinely doing well? That’s where financial ratios come in.
Let’s break them down using a fictional business example.
What Are Financial Ratios?
Financial ratios are calculations that compare figures from a company’s financial statements to help assess its performance and financial position.
Instead of looking at revenue, expenses, assets, and debts separately, ratios help you understand how these figures relate to one another (Fridson, 2025).
Why does this matter?
Businesses need to know whether they’re profitable, financially stable, and using their resources efficiently to remain competitive.
Regardless of the industry, the Threat of New Entrants is always present. Understanding your numbers can help you fight your tough competitors.
In short, ratios turn raw financial data into insights that support decision-making strategies.
The Case of Wisteria Inc.

Let’s put theory into practice with Wisteria Inc., a fictional Singapore-based business selling wisteria flowers, herbal products and botanical skincare.
Imagine that its owner, Shinobu Kochou, wants to know whether the business is financially healthy before expanding into a competitive market.
First, we need two essential financial statements: The Income Statement (Figure 1) and the Balance Sheet (Figure 2).
Figure 1
Income Statement
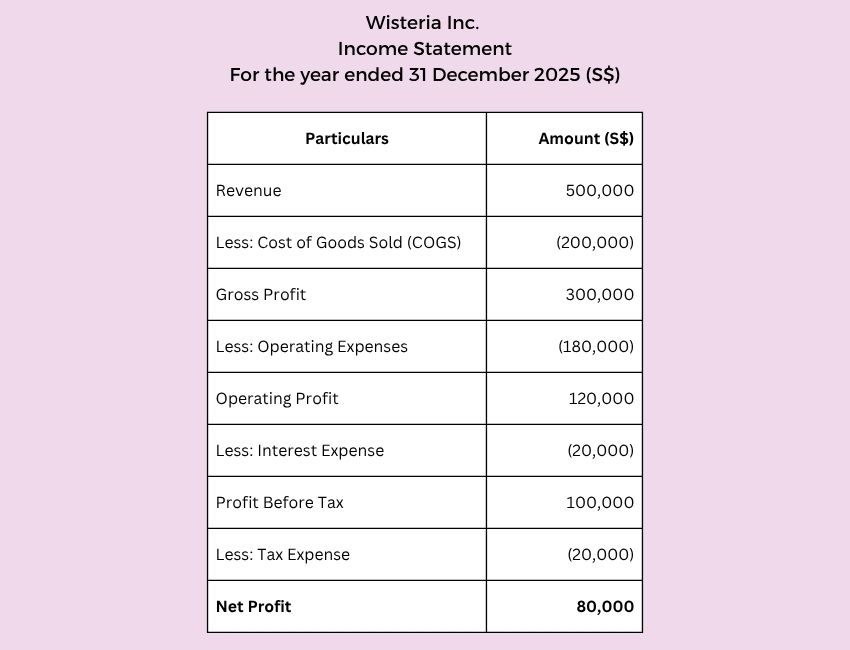
Figure 2
Balance Sheet
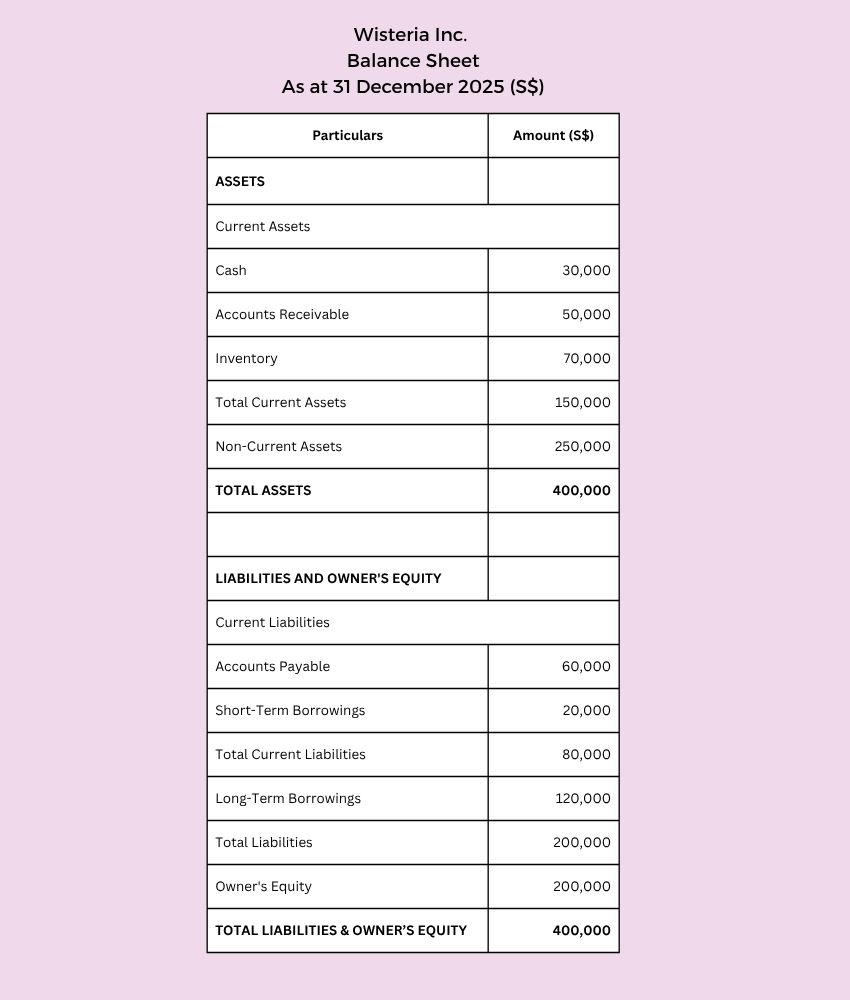
Following the accounting equation, notice that total assets equal total liabilities plus owner’s equity: S$400,000 = S$200,000 + S$200,000.
The balance sheet balances, so we can move on to the interesting part: interpreting the numbers.
The Four Financial Ratio Tests
1. Profitability Ratios: Is the Business Making Money?
Profitability ratios measure how effectively a business generates profit from its sales or other resources (Vipond, 2020).
High sales might look impressive, but what matters is how much money the business actually keeps.
Gross Profit Margin
This measures the percentage of revenue remaining after deducting the direct cost of producing or purchasing goods sold.
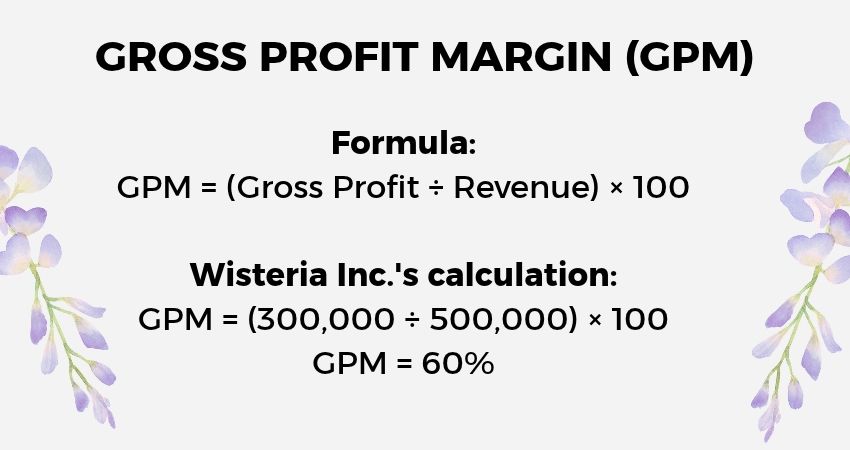
This means Wisteria retains S$0.60 in gross profit for every S$1 of revenue before operating expenses, interest, and tax.
That’s a useful starting point, although we’d need industry benchmarks to determine whether 60% is competitive.
Net Profit Margin
This measures the percentage of revenue remaining as profit after all expenses, including interest and tax, have been deducted.
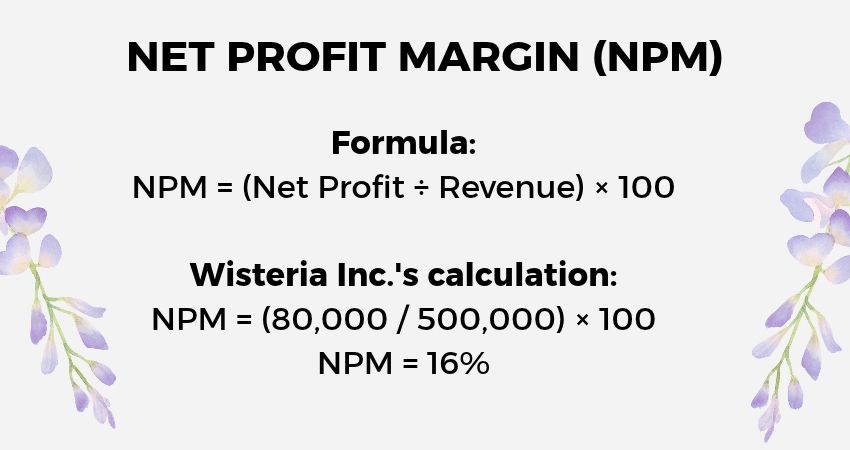
Wisteria earns S$0.16 in net profit for every S$1 of revenue.
Comparing its 60% gross margin with its 16% net margin also highlights how much of its gross profit is absorbed by operating costs, interest, and tax.
2. Liquidity Ratios: Can the Business Pay Its Bills?
Liquidity ratios assess whether a company can meet its short-term financial obligations (Corporate Finance Institute [CFI], 2020].
A business might be profitable on paper but still face cash-flow problems if it cannot pay suppliers or settle upcoming bills.
Current Ratio
This compares current assets with current liabilities to assess short-term financial coverage.
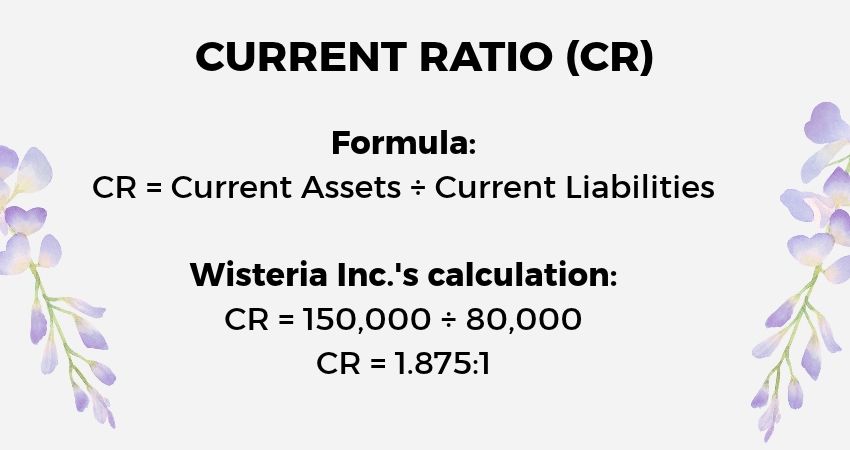
Wisteria has S$1.875 in current assets for every S$1 of current liabilities.
At first glance, this suggests reasonable short-term coverage. However, current assets include inventory and receivables, which may not be converted into cash immediately.
Quick Ratio
The quick ratio is a stricter liquidity measure because it excludes inventory, which may take time to sell.
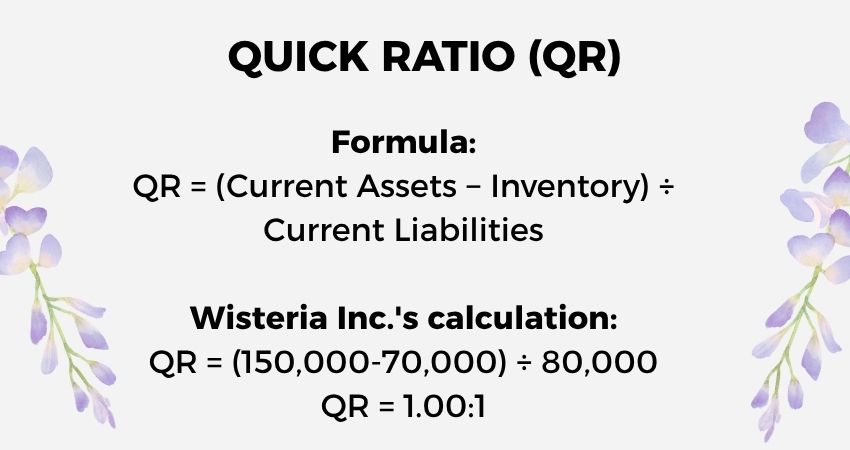
Wisteria has S$1 in quick assets for every S$1 of current liabilities.
This suggests that its cash and receivables match its short-term obligations in value.
However, the timing of customer payments and upcoming bills still matters.
3. Efficiency Ratios: Is the Business Using Its Resources Well?
Efficiency ratios examine how effectively a company uses its assets and working capital to generate sales (CFI, 2019).
After all, owning plenty of inventory or expensive equipment doesn’t automatically mean a business is operating efficiently.
For the following calculations, assume Wisteria’s opening inventory was S$50,000 and its opening total assets were S$350,000.
Inventory Turnover
This measures how many times a business sells and replaces its average inventory during a period.
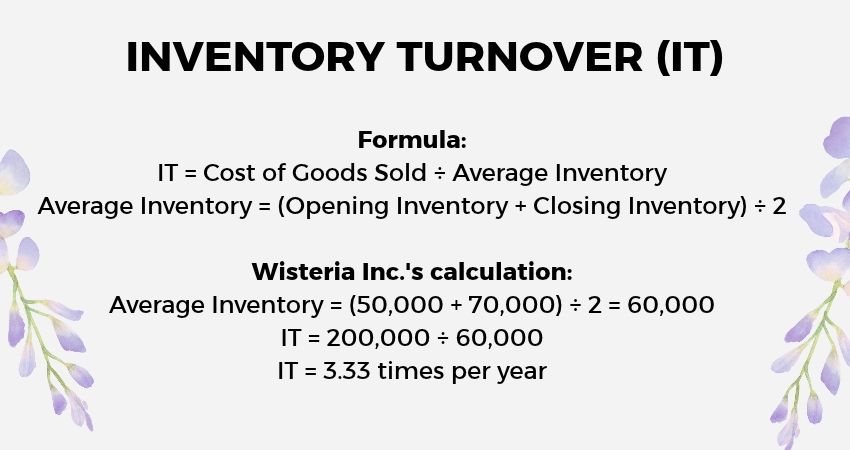
Wisteria sells and replaces its average inventory approximately 3.33 times during the year.
Whether this is efficient depends on the type of products it sells and how quickly comparable businesses turn over their inventory.
A very low turnover could indicate slow-moving stock, while an excessively high turnover might signal insufficient inventory.
Total Asset Turnover
This measures how effectively a company uses its assets to generate revenue.
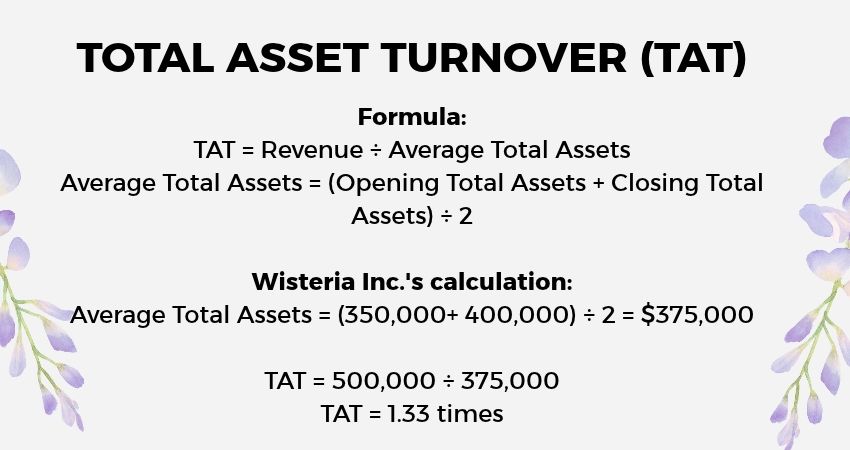
Wisteria generates approximately S$1.33 in revenue for ever S$1 of average assets.
This provides a useful indication of asset utilisation, although comparisons with similar businesses are needed to judge whether its performance is strong.
4. Solvency Ratios: Can the Business Handle Its Debts?
Solvency ratios examine a company’s ability to meet its longer-term financial obligations.
While liquidity focuses on the short term, solvency looks at the bigger picture: whether a business’s debt burden is sustainable.
Debt-to-Equity Ratio
This measures the relationship between a company’s total liabilities and its owner’s equity.
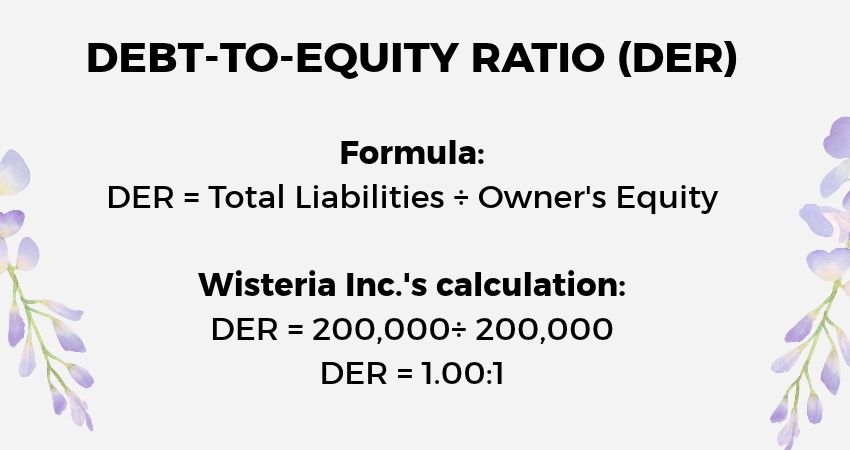
Wisteria has S$1 in total liabilities for every S$ of owner’s equity.
This indicates that its liabilities and equity are equal in value.
It doesn’t automatically mean the business is overleveraged, but the result should be assessed against industry norms and its capacity to repay debt.
Interest Coverage Ratio
This measures how comfortably a business’s operating profit covers its interest expense.
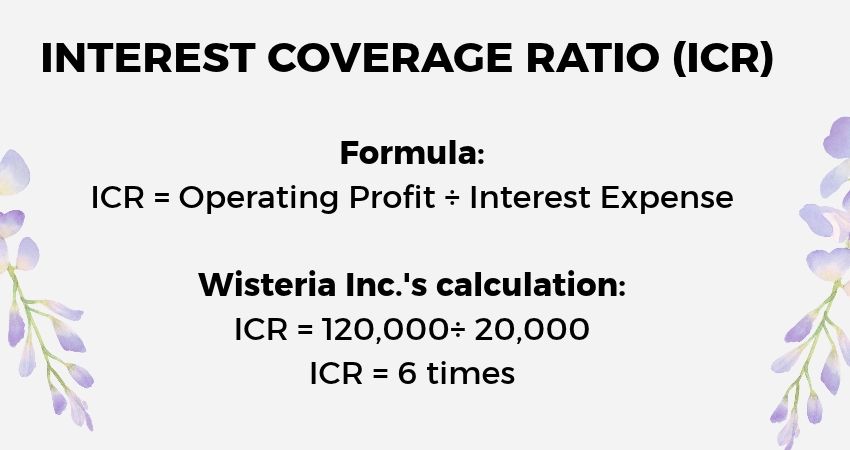
Wisteria earns six times its annual interest expense in operating profit.
This suggests that it has a reasonable operating-profit buffer for servicing interest payments.
However, interest coverage doesn’t measure its ability to repay the principal amount of its borrowings.
The Verdict: Is Wisteria Inc. Financially Healthy?
So, is Wisteria Inc. doing well?
The results paint a reasonably encouraging picture.
Its 16% net profit margin indicates that it generates profit from sales, its 1.875:1 current ratio suggests short-term asset coverage, and its six-times interest coverage indicates that operating profit comfortably exceeds interest expense.
Still, there are reasons to look closer.
Its inventory turnover and asset utilisation need industry comparisons, while its debt-to-equity ratio highlights the importance of managing liabilities.
Without historical results or industry benchmarks, we cannot confidently declare Wisteria a market leader. The lesson? Financial ratios provide useful clues, not a complete verdict.
Final Form: Don’t Just Calculate—Breathe and Interpret!
Financial ratios might seem intimidating at first, but they become much easier when you understand the question each one answers.
Profitability asks whether a business makes money; liquidity examines its short-term obligations; efficiency looks at resource utilisation; and solvency considers longer-term financial stability.
If you’re tackling a financial analysis assignment, don’t stop after plugging figures into formulas.
Explain what the results suggest, identify possible risks, and compare your findings with industry benchmarks or previous years wherever possible.
That’s how you move beyond calculation and demonstrate genuine financial understanding.
Ultimately, the goal isn’t just to get the numbers right—it’s to explain what those numbers mean for the business.
References:
Corporate Finance Institute. (2020). Liquidity Ratio. https://corporatefinanceinstitute.com/resources/accounting/liquidity-ratio/
Corporate Finance Institute. (2019). Efficiency Ratio. https://corporatefinanceinstitute.com/resources/accounting/efficiency-ratios/
Fridson, M. S. (2025). UNIT 4 FINANCIAL ANALYSIS: KEY TYPES AND RATIOS. Yuliia HLAVATSKA, Kateryna SOVACH, 68. https://files.znu.edu.ua/files/Bibliobooks/Inshi85/0064920.pdf#page=68
Vipond, T. (2020). Profitability Ratios. https://corporatefinanceinstitute.com/resources/accounting/profitability-ratios/

About Nick
Nick loves the written word. He spends part of his days wondering how to combine his two loves, writing and traveling. The rest of his time he spends having a little wine with friends along Siglap.
You must be logged in to post a comment.